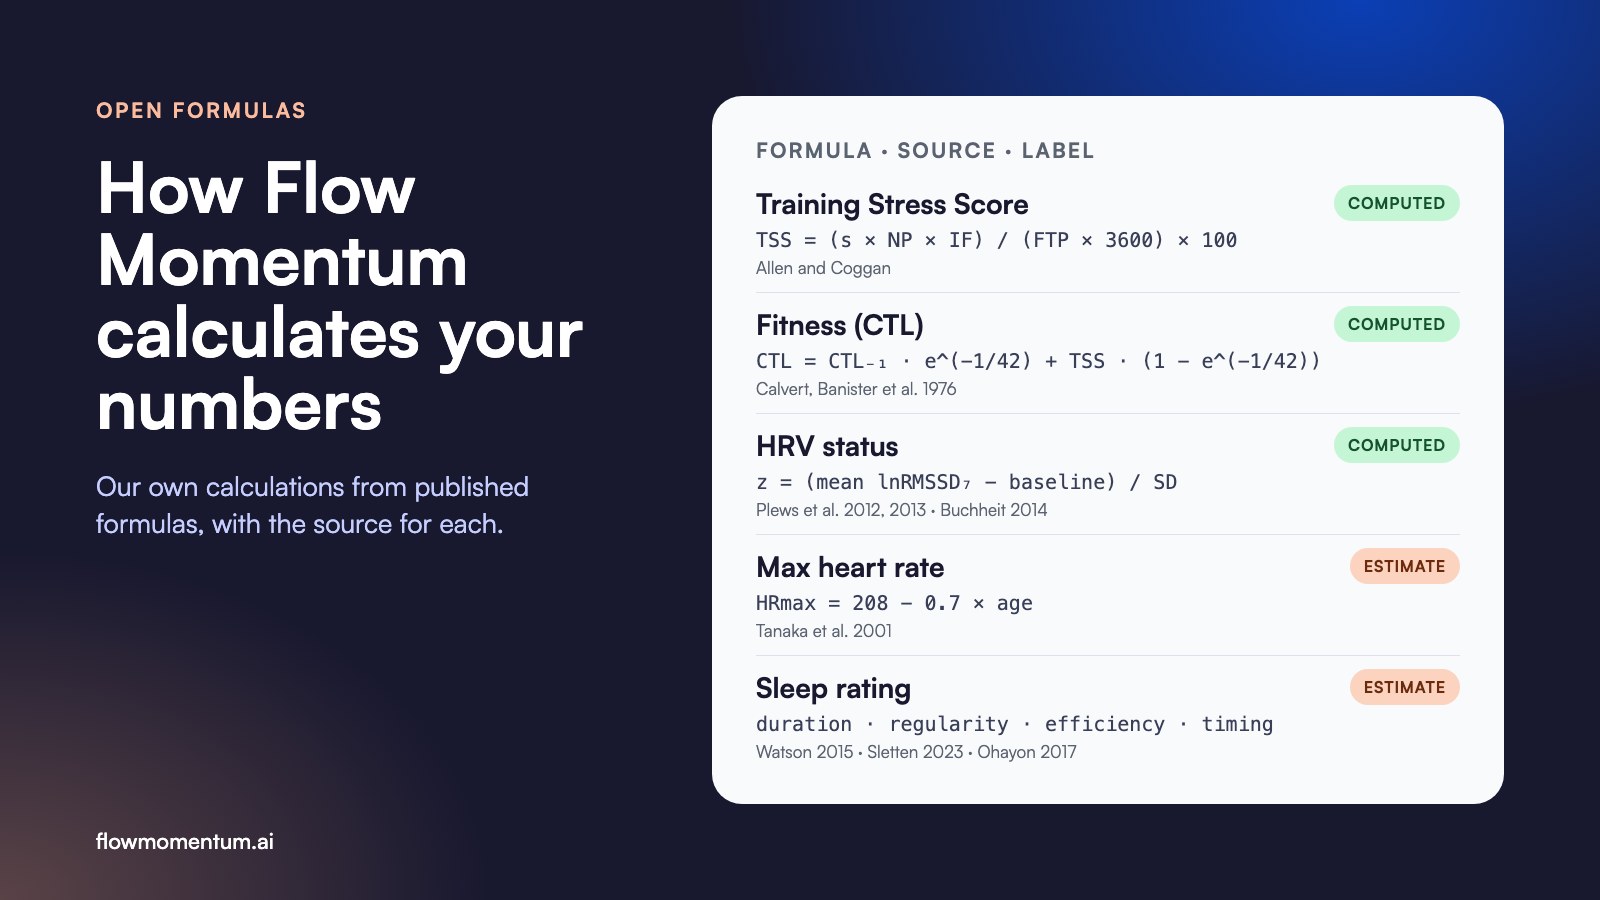
How Flow Momentum Calculates Your Numbers
Our own calculations from open, published formulas, with a worked example and the original source for each.
In short: Flow Momentum calculates its indicators itself, with open formulas from published sources. We do not show scores that a manufacturer calculates with a closed algorithm. Estimates carry an "estimate" label. Without enough data, a value is "insufficient", never invented.
A number is only useful when you know where it comes from.
Many apps show scores that nobody outside the manufacturer can check. We chose a different way on 12 November 2026. For each value, we went back to the publication that first defined it. We use that formula and name the source, so you can check the calculation yourself.
This note lists each value with its formula, a worked example and its source. It also says what is live today and what comes next.
Why open formulas
- You can check them. Each formula is published. A coach or a sports scientist can recalculate your values.
- They need raw measurements only. Power, heart rate, pace and sleep times are enough. No closed score is an input.
- They stay stable. A manufacturer can change a closed score with a software update. A published formula does not change overnight.
Your device still matters as a sensor. It measures heart rate, power and sleep times. We take these measurements and do the calculation ourselves.
What we no longer show
Since 12 November 2026, the dashboard and the AI coaches show no closed manufacturer scores. Examples are sleep scores, Body Battery, stress scores, Training Readiness and watch estimates of VO2max.
Some of these have a replacement from an open formula (the HRV status, the sleep rating). Others have none, because no open formula exists. Body Battery and the stress score are simply gone.
Two limits apply today. Readiness and race readiness still take manufacturer inputs inside their calculation. Both are labelled estimates, and their replacements are in the section "What comes next".
Three kinds of values
Every value has one of three labels.
- Measured. A sensor recorded it, for example your resting heart rate or your sleep duration.
- Computed. We calculate it from your measurements with a published formula.
- Estimate. We calculate it with a model that is not fully validated. A value you test or enter always replaces it.
When there is not enough data, the value is "insufficient". We do not invent a number to fill the gap.
Training load
Training load starts with the Training Stress Score (TSS). One hour at threshold gives 100 TSS.
- Cycling with power: TSS = (duration in seconds × NP × IF) / (FTP × 3600) × 100. NP is Normalized Power and IF = NP / FTP (Allen and Coggan).
- Running with pace: IF = threshold pace / average pace, and rTSS = hours × IF² × 100 (TrainingPeaks). There is no grade adjustment yet.
- Heart rate only: hours × (average HR / threshold HR)² × 100. This is our own simplification, so it is an estimate.
- Duration only: a fixed intensity per sport, for example 0.72 for a run. This is the most conservative fallback.
Worked example, cycling. You ride for 90 minutes with an NP of 200 W. Your FTP is 250 W, so IF is 0.80. TSS = (5400 × 200 × 0.80) / (250 × 3600) × 100 = 96.
Worked example, running. You run for 50 minutes at 5:24 per km. Your threshold pace is 4:30 per km. IF = 270 s / 324 s = 0.83, and rTSS = 0.83 hours × 0.83² × 100 = 58.
Fitness, fatigue and form
From the daily TSS we calculate three values. They are a simplified form of the impulse-response model of Banister and colleagues (Calvert et al., 1976; Morton et al., 1990). Training platforms use this form as a weighted average of the daily load (Kontro et al., 2026).
- Fitness (CTL): an exponentially weighted average with a 42-day time constant.
- Fatigue (ATL): the same calculation with a 7-day time constant.
- Form (TSB): CTL minus ATL of the previous day.
The daily step is: new value = old value × e^(−1/T) + today's TSS × (1 − e^(−1/T)). T is 42 for fitness and 7 for fatigue.
What this is and what it is not. The two time constants are fixed and the same for every athlete. The original model fits them to one athlete, from that athlete's own performances. Morton et al. (1990) use 45 and 15 days in their example. Hellard et al. (2006) fitted the model to nine elite swimmers. It matched past performances well. The time constants were uncertain: 38 days (17 to 59) for fitness and 19 days (6 to 32) for fatigue. Busso and Chalencon (2023) used the fitted model to predict the performance of eleven swimmers. The error was 2.0 % for the next eight weeks and 2.7 % for the next season. The authors found this not good enough to plan the training of one athlete. Read fitness, fatigue and form as a summary of your recent load. They are not a forecast of your performance.
Worked example. Your fitness is 50 and your fatigue is 60. Today you ride the 96 TSS from above.
- Fitness: 50 × 0.9765 + 96 × 0.0235 = 51.1
- Fatigue: 60 × 0.8669 + 96 × 0.1331 = 64.8
- Form tomorrow: 51.1 − 64.8 = −13.7
One hard ride moves fatigue by almost 5 points and fitness by about 1. That is the whole idea: fatigue reacts fast, fitness builds slowly.
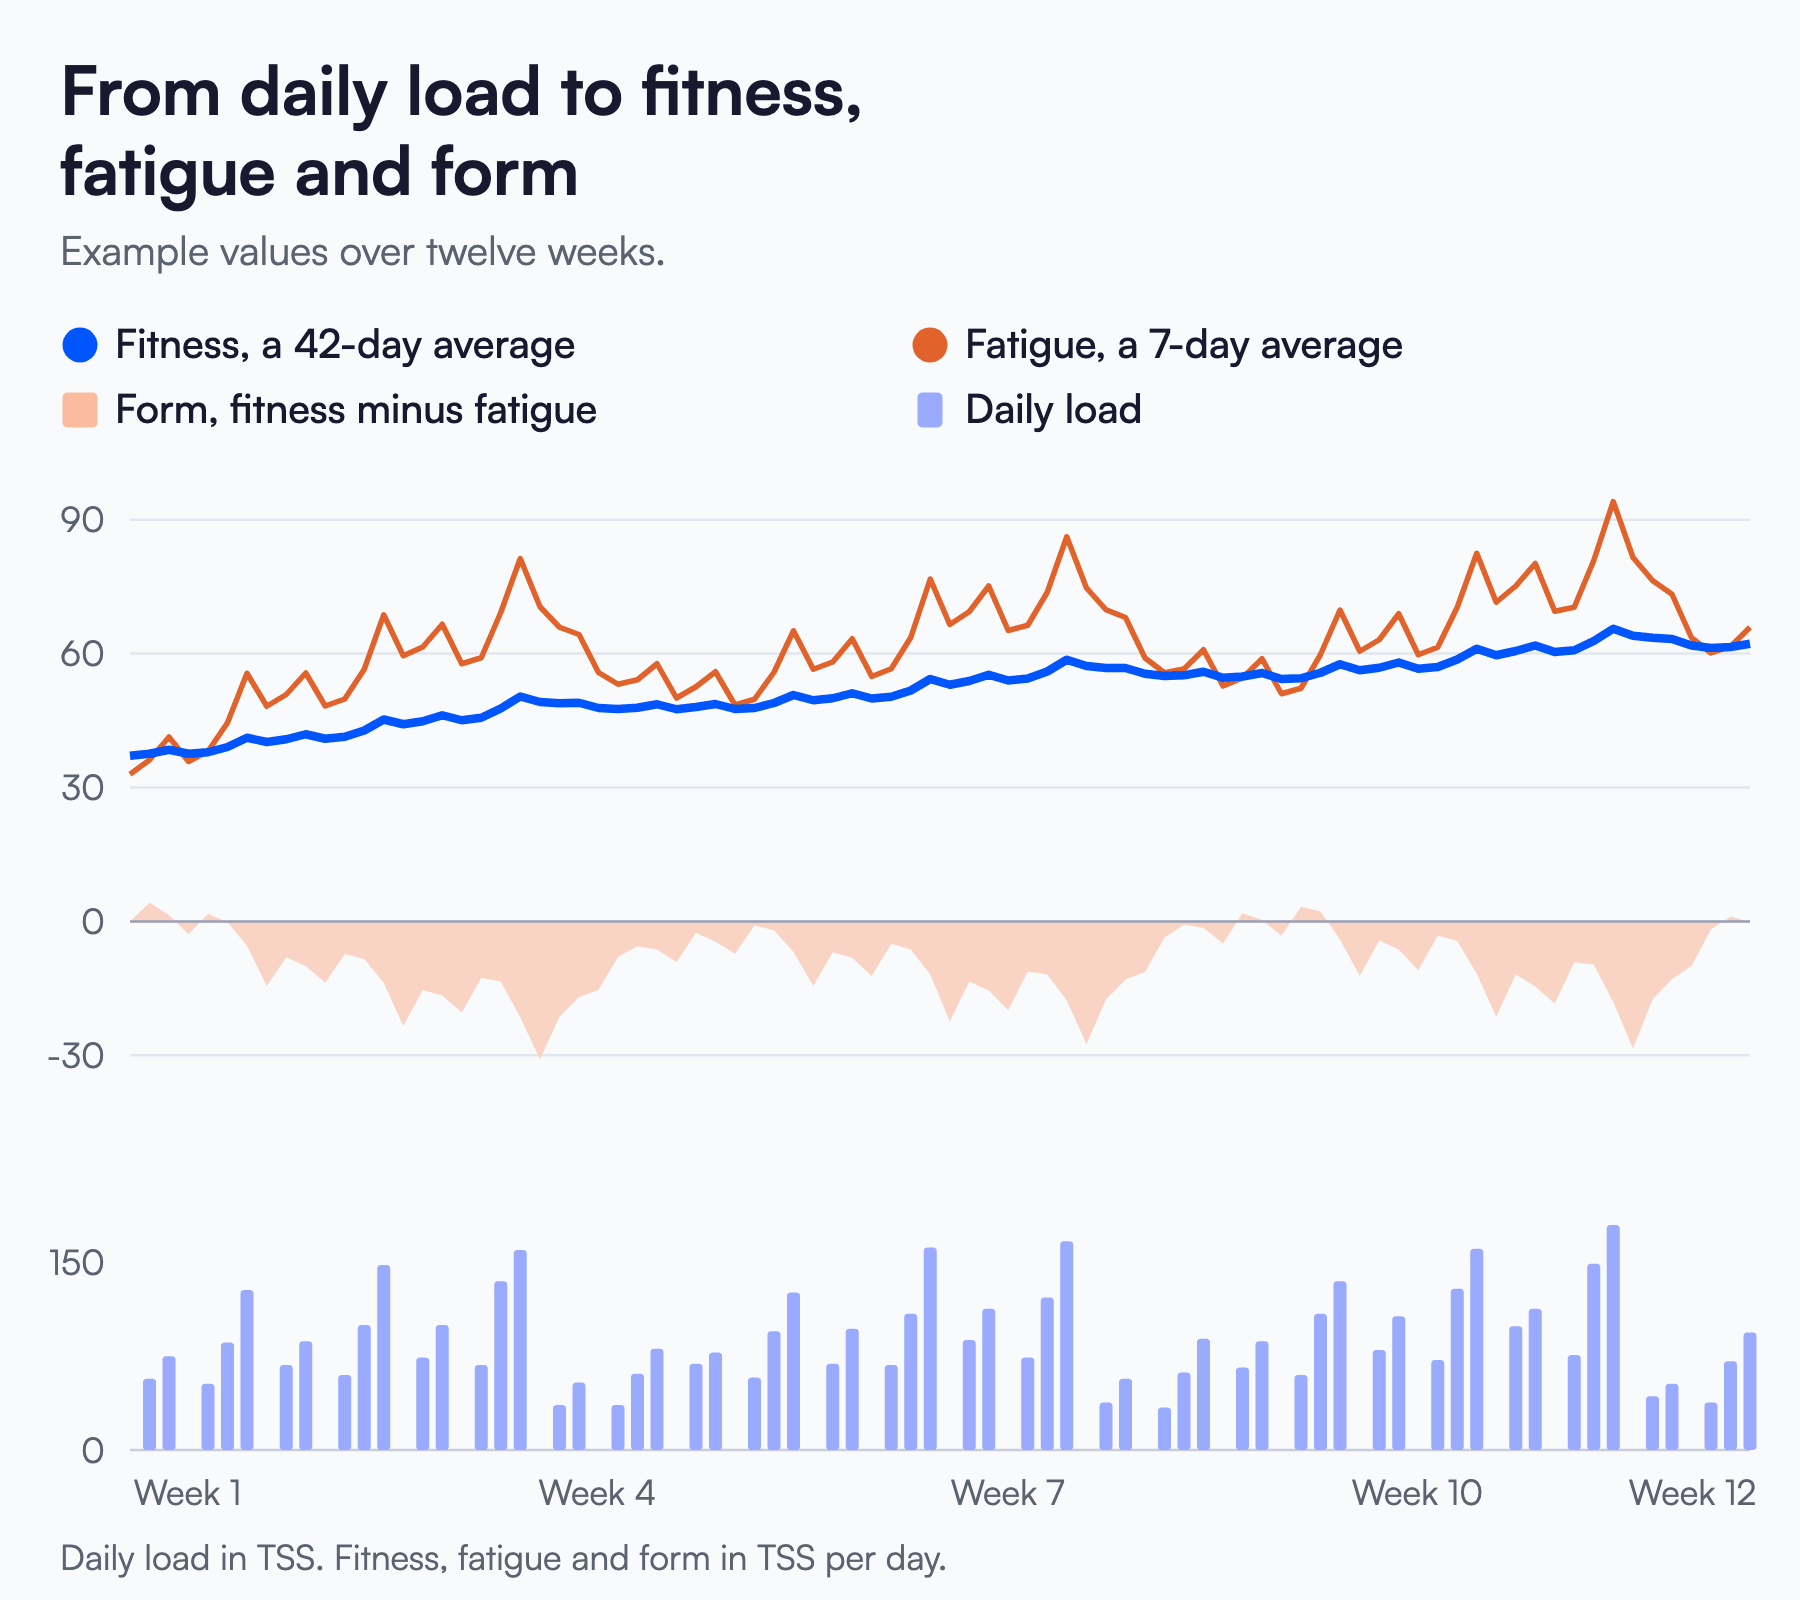
Rest days count as TSS 0, so fitness decays when you do not train.
We read form in bands:
| Form (TSB) | Band |
|---|---|
| above 15 | fresh |
| 5 to 15 | optimal |
| −10 to 5 | grey zone |
| −30 to −10 | fatigued |
| below −30 | overreached |
The bands follow the TrainingPeaks convention. They are guidance, not a law of physiology. In the example, −13.7 falls in "fatigued".
Training monotony and strain follow Foster (1998). Foster used session-RPE load; we apply his formula to TSS.
We do not use the acute:chronic workload ratio. Impellizzeri and colleagues (2020) conclude that "there is no evidence supporting the use of ACWR in training-load-management systems".
Planned load
Your plan shows a planned load for each session and each week. It is duration × a load per hour for the session type. An easy session counts 42 TSS per hour and a VO2max session 81.
Worked example. An easy run of 30 minutes has a planned load of 0.5 × 42 = 21 TSS.
The load per hour is a coaching convention without a published source. Planned load is therefore an estimate. A planned session counts towards fitness, fatigue and form only after you record or confirm it.
Sessions without a recording
Sometimes you train without a watch. You can then confirm the planned session with "Done as planned". It counts towards fitness, fatigue and form.
The load depends on what you enter.
- Nothing changed: the planned load of the session.
- Duration changed: the planned load, scaled with the duration.
- Effort given: the session-RPE load.
The session-RPE method comes from Foster and colleagues (2001). The load is your perceived effort (0 to 10) × the duration in minutes. Haddad and colleagues (2017) reviewed 36 validation studies and confirmed its validity and good reliability.
No published formula converts this load to TSS. We use hours × effort × 12.5, so one hour at effort 8 gives 100. This step is our own estimate.
Worked example. You confirm an easy run of 30 minutes with effort 4. The session-RPE load is 4 × 30 = 120. On the TSS scale it is 0.5 × 4 × 12.5 = 25 TSS.
A confirmed session carries the note "confirmed as planned, not recorded". If a recording of the same sport arrives for that day, it replaces the confirmed entry. No session counts twice.
Yoga, tai chi and strength
You can add complementary sessions to your plan: gentle yoga, tai chi, a mobility routine or bodyweight strength. The plan contains only the kinds you choose.
These sessions never replace or move an endurance session. They sit on days without a hard, long or test session.
Their planned load is the session-RPE load at an expected effort. Yoga, tai chi and mobility count with effort 2, and bodyweight strength with effort 5.
Worked example. Gentle yoga of 30 minutes gives 0.5 × 2 × 12.5 = 12.5 TSS.
The expected effort and the placement rules are our own convention. Two reviews give the background. Rønnestad and Mujika (2014) reviewed strength training for running and cycling performance. Cohen and Tyagi (2016) reviewed the studies on yoga and heart rate variability.
Thresholds
- FTP from a test: 20-minute test × 0.95 (Allen and Coggan). A 60-minute effort counts as it is. A ramp test gives 0.75 × the best minute, a common convention without one original study.
- Critical Power and W′: the model P(t) = CP + W′ / t (Monod and Scherrer, 1965; Jones et al., 2010). It uses your maximal efforts of 3 to 20 minutes.
- Running threshold pace: your best sustained run of at least 20 minutes, or a critical-speed fit. It is an estimate. Running power stays separate from cycling FTP.
- Swim critical speed: your fastest sustained pace over at least 400 m (Wakayoshi et al., 1992). It is an estimate. The two-distance test is not built yet.
- Threshold heart rate: 20-minute test average × 0.95, or the last 20 minutes of a 30-minute time trial (Friel).
- Maximal heart rate: 208 − 0.7 × age (Tanaka et al., 2001). A measured maximum always wins.
A value you type in is labelled "entered", not "tested".
Worked example, FTP. You average 260 W in a 20-minute test. FTP = 260 × 0.95 = 247 W.
Worked example, Critical Power. You hold 360 W for 3 minutes and 300 W for 12 minutes. CP = (300 × 720 − 360 × 180) / (720 − 180) = 280 W. W′ = (360 − 280) × 180 = 14 400 J, or 14.4 kJ.
Worked example, maximal heart rate. At 45 years, the estimate is 208 − 0.7 × 45 = 177 beats per minute.
Training zones use the seven power zones of Allen and Coggan and the heart-rate zones of Friel.
HRV status
We calculate an open HRV status from your nightly RMSSD values (Plews et al., 2012 and 2013; Buchheit, 2014).
- We take the natural log of each night's RMSSD.
- Your current value is the mean of the last 7 nights. We need at least 4 valid nights.
- Your baseline is the mean and standard deviation of the 53 nights before. We need at least 14 valid nights.
- The z-score is (current − baseline) / baseline SD.
| z-score | HRV status |
|---|---|
| above +1 | above baseline |
| −1 to +1 | within baseline |
| −2 to −1 | below baseline |
| under −2 | well below baseline |
Worked example. Your baseline is 4.00 in log units (about 55 ms), with an SD of 0.10. Your last 7 nights average 3.85 (about 47 ms). The z-score is (3.85 − 4.00) / 0.10 = −1.5. Your status is "below baseline".
We also report the night-to-night variation when there are at least 5 nights.
One limit applies. Buchheit (2014) describes night recordings as noisier than short morning measurements. We therefore use the 7-night mean, not a single night.
Your resting heart rate is shown as a measurement, against your own recent average.
Sleep rating
We built our own sleep rating. It uses four parts, and each part scores 0 to 100.
| Part | Full points | Weight |
|---|---|---|
| Duration | 7 hours or more | 40 % |
| Regularity | within 30 minutes | 25 % |
| Efficiency | 87.5 % or more | 20 % |
| Timing | within 30 minutes | 15 % |
- Duration is your mean sleep time over 7 nights. A mean of 5 hours gives no points.
- Regularity is the spread of your sleep and wake times over 7 nights. A spread of 90 minutes gives no points.
- Efficiency is sleep time divided by sleep time plus time awake. A value of 75 % gives no points.
- Timing compares last night's mid-sleep with your own habit. A shift of 120 minutes gives no points.
Between the limits, the points rise in a straight line. The rating needs at least 4 nights.
The sources are consensus papers and field studies:
- Duration: adults should sleep 7 or more hours per night (Watson et al., 2015).
- Regularity: an expert panel agreed that regular sleep timing matters for health and performance (Sletten et al., 2023). Phillips and colleagues (2017) defined the Sleep Regularity Index. Our value is simpler: the spread of your sleep times.
- Efficiency: an expert panel named sleep efficiency as an appropriate indicator of good sleep quality (Ohayon et al., 2017). The National Sleep Foundation sums it up as "7 out of 8 hours" asleep, which is 87.5 %.
- Timing: a shift between your body clock and your schedule is known as social jetlag (Wittmann et al., 2006).
Worked example. You sleep 6.5 hours on average, and your times vary by 45 minutes. Your efficiency is 95 %, and last night's mid-sleep was 20 minutes off.
- Duration: (6.5 − 5) / (7 − 5) = 75 points
- Regularity: (90 − 45) / (90 − 30) = 75 points
- Efficiency and timing: 100 points each
- Rating: 0.40 × 75 + 0.25 × 75 + 0.20 × 100 + 0.15 × 100 = 84
The words are "restorative" from 80, "sufficient" from 60 and "borderline" from 40. One rule sits on top: "restorative" needs a 7-night mean of 7 hours. In the example the rating is 84, but the word is "sufficient".
The parts are well supported. The weights and the "no points" limits are our own choice, because no validated weighting exists. The rating is therefore an estimate.
Three limits are worth knowing:
- We do not use sleep stages. The same expert panel found less or no consensus on sleep stages as a sign of good sleep.
- A watch reports very little time awake. The efficiency part is close to 100 for most nights and separates athletes poorly.
- Athletes differ in how much sleep they need (Walsh et al., 2021). We therefore also compare each night with your own habit.
You find the rating in the detail of the sleep light on Today. The coach reads it from your state card.
Traffic light and trend arrow
Every tile on the dashboard has a traffic light and a trend arrow. Each one comes with a word, never colour alone.
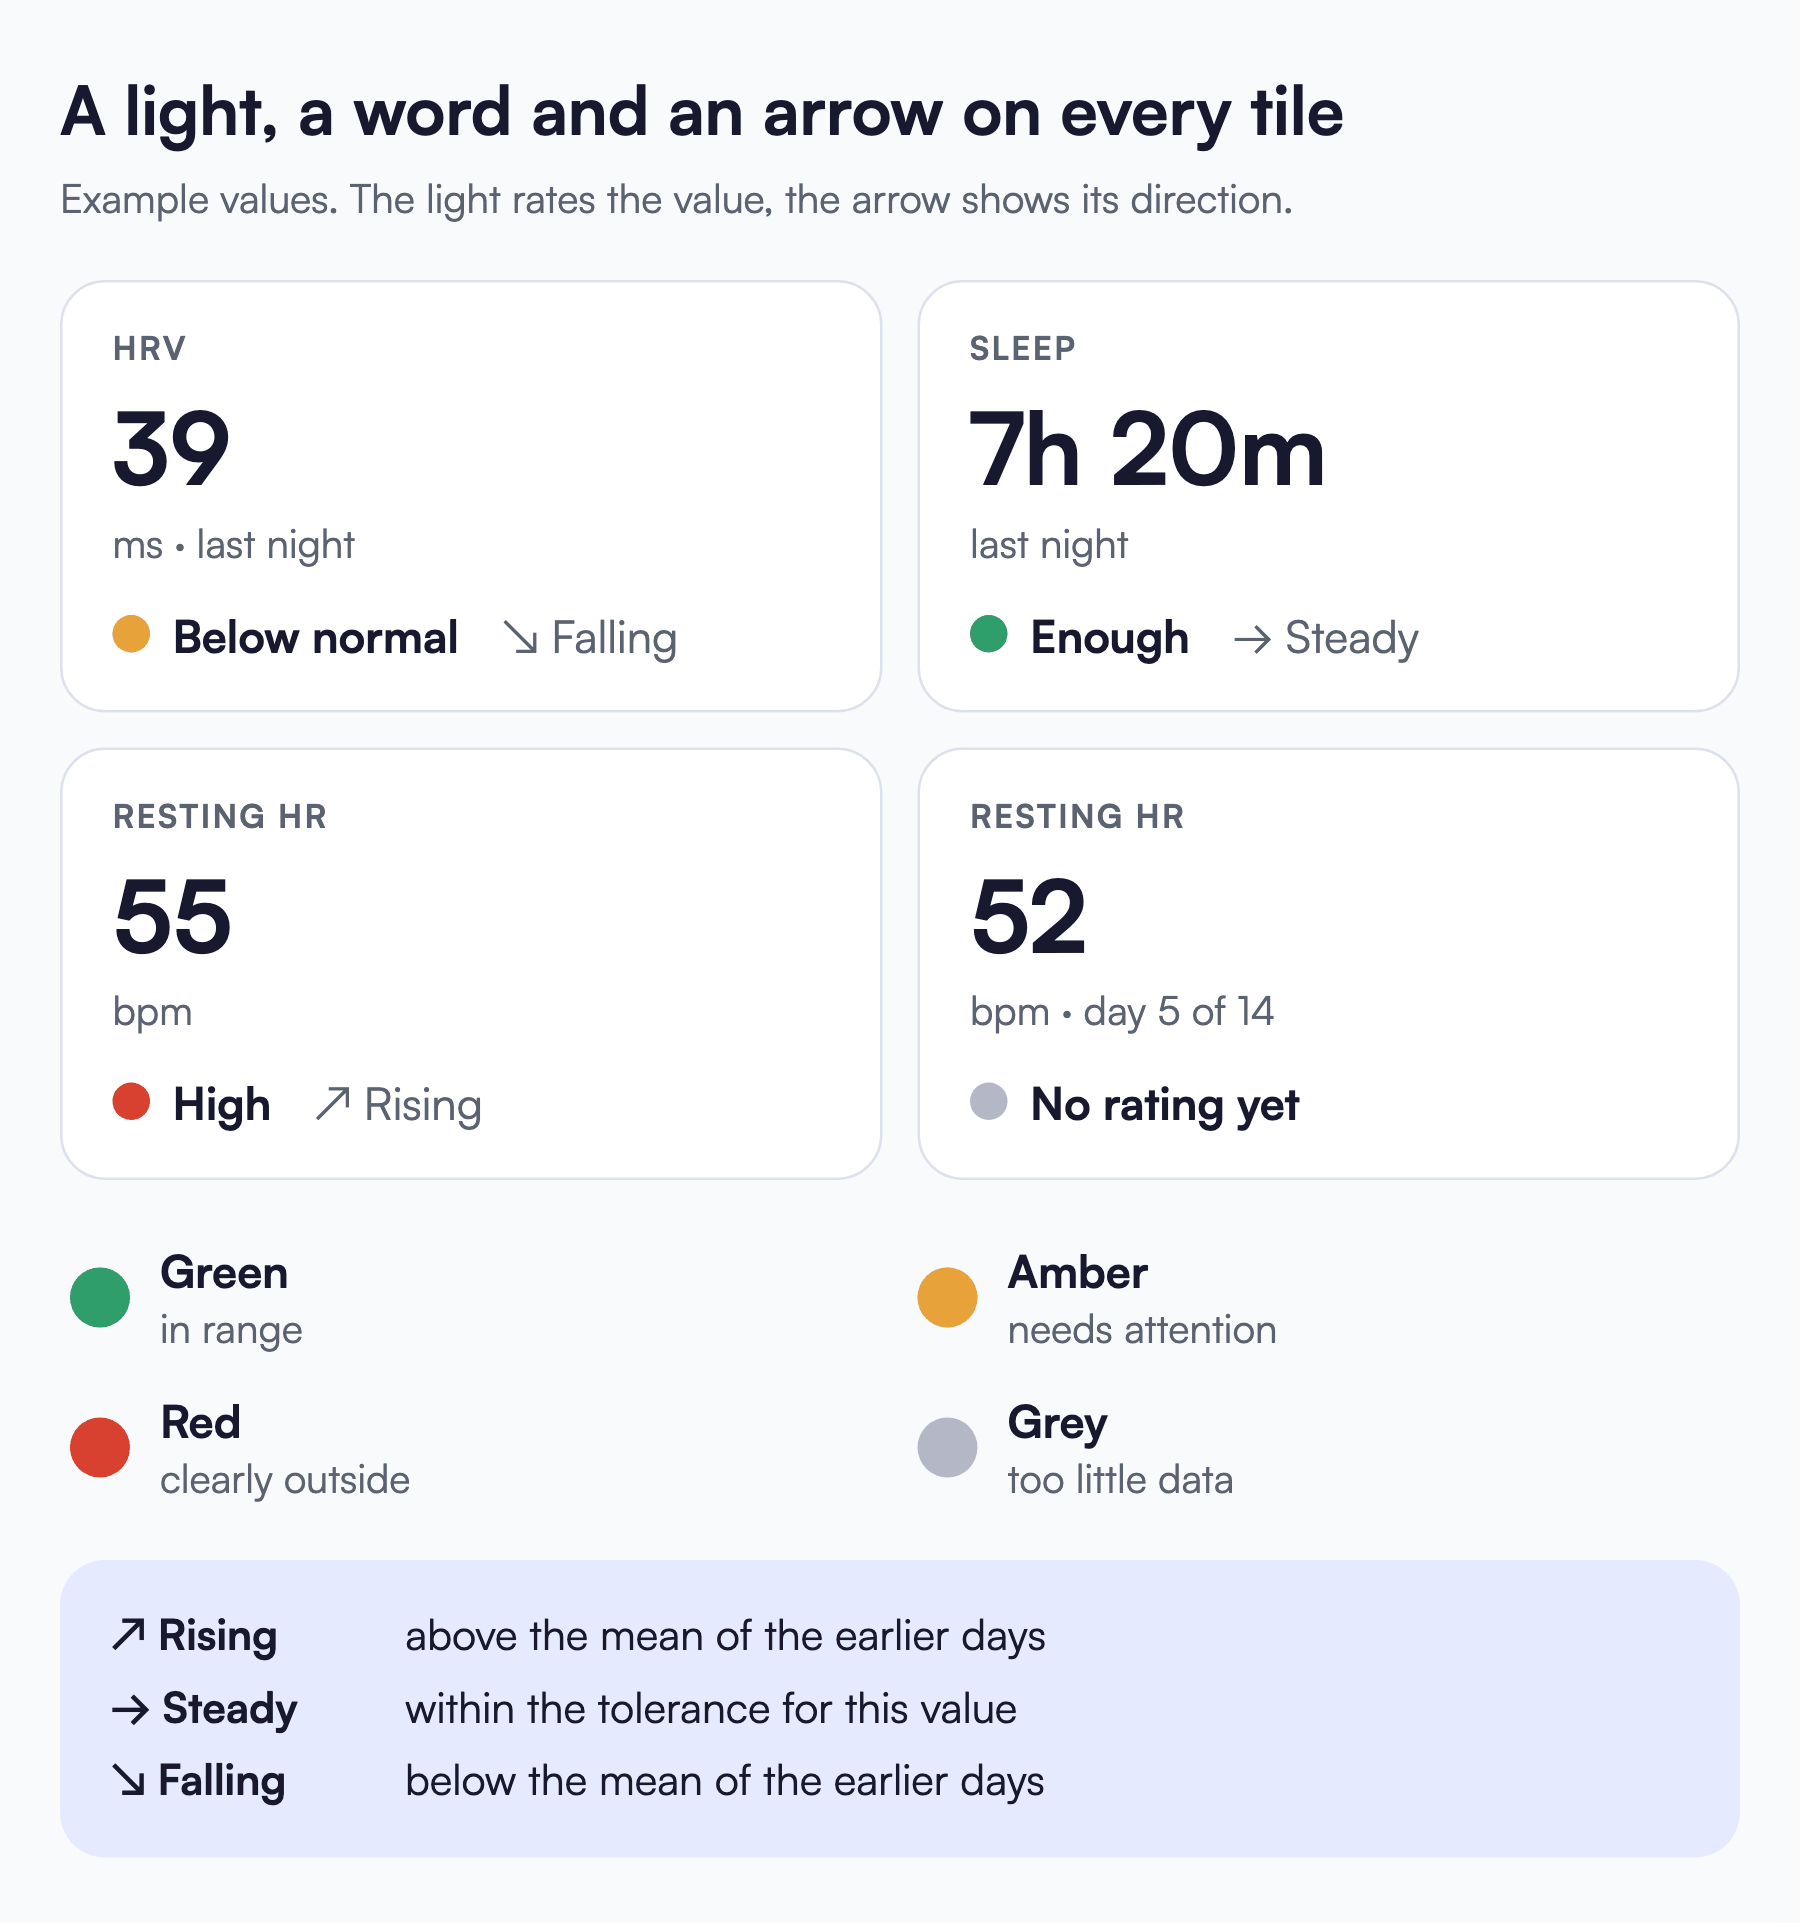
Grey means there is too little data for a rating. No limit comes from a manufacturer score.
- Recovery: green with an HRV status z of −1 or higher. Amber runs from −2 to under −1, and red is under −2 (Plews et al., 2012 and 2013; Buchheit, 2014).
- Sleep on Today: green with a 7-night mean of 7 hours or more and a regular bedtime. Amber means 6 to under 7 hours, or an irregular bedtime. Red means under 6 hours (Watson et al., 2015; Phillips et al., 2017).
- Sleep, last night: green from 7 hours and amber from 6 to under 7 hours. Red means under 6 hours (Watson et al., 2015).
- Resting heart rate: green up to 1 SD above your normal. Amber runs from 1 to 2 SD, and red is above 2 SD. The band is our own, so it is an estimate.
- Goal: green with a race readiness of 75 or more, amber from 50 to under 75, red under 50. The bands are our own, so they are an estimate.
- Threshold: green when you set the value, amber when it is an estimate. This light shows how reliable the value is.
Some details:
- A check-in of "ill" or "injured" turns the recovery light red.
- A bedtime counts as regular when it varies by 30 minutes or less.
- The resting heart rate light needs 14 earlier days. A lower value is never a warning.
- A threshold is a reference value, not a state of your body. Its light has no red.
The trend arrow compares the latest value with the mean of the earlier days, up to 7. It needs three values. The words are "Rising", "Steady" and "Falling".
| Value | "Steady" within |
|---|---|
| HRV | 2 ms |
| Sleep duration | 0.5 hours |
| Resting heart rate | 1 beat per minute |
These tolerances are our own choice, without a published source. The arrow has no colour. Whether a rise is good depends on the value, and the light answers that.
Worked example. Your resting heart rate is 55 today. Over the earlier days your mean was 50, with an SD of 2. Today is 2.5 SD above your normal, so the light is red and the word is "High". The arrow says "Rising".
Devices and data sources
Training values work with a connected Garmin account and with file uploads (FIT, TCX, GPX).
Sleep, HRV and resting heart rate come from a connected Garmin account or from your own entry. You can add last night by hand in the check-in.
Values you enter feed the same open formulas. They carry the note "entered by you". If a connected device sends a value for the same night, the device value counts.
When a value uses data from a Garmin device, we say so. The head of the dashboard names the source as "Garmin" with the device model. Each value on your state card also carries its input source.
Strava data stay separate. They never reach the AI coaches or any calculation for them.
How the AI coach uses these numbers
Every day Flow Momentum builds a state card for you. It contains your current values, with their labels, dates and sources. It also lists what is missing.
The coach must take personal numbers from this card. Before you see an answer, a server check compares each personal number with the card. When a value is missing, the coach asks you instead of guessing.
How we check our calculations
The formulas have automated tests with worked examples.
For some methods we also use GoldenCheetah as an independent reference. GoldenCheetah is an open-source analysis program that many coaches and scientists use. Today this covers the search for best efforts inside a session. We do not copy its code.
What comes next
These parts are planned or in testing. You cannot see them in the product yet.
- Heart-rate load. A TRIMP method will replace our own heart-rate simplification. The formula is in testing and not active. It weights each minute by a × e^(b × x). Here x is the share of the heart-rate reserve. For men a is 0.64 and b is 1.92. For women a is 0.86 and b is 1.67. We read this form in the review by Borresen and Lambert (2009). The original paper by Morton, Fitz-Clarke and Banister (1990) has the same weighting without the factor a. On our load scale the factor cancels out. Two zone-based methods (Edwards, Lucía) are also in testing.
- Readiness without manufacturer inputs. The new formula uses HRV, resting heart rate, sleep, your check-in and form. It runs in the background while we compare it. The race readiness behind the Goal light follows the same path.
- Estimates from a race or test. Two formulas are in testing and not active. The first gives VDOT, a performance index from a race time. VDOT is not a measured VO2max. Scudamore et al. (2018) compared it with laboratory values. It was 4.7 % lower in college track athletes and 9.2 % lower in recreational runners. If we show it, we will call it VDOT and mark it as an estimate. We take its equations from the GoldenCheetah reference, which attributes them to Daniels and Gilbert (1979). We have not read that book. The second formula estimates VO2max from the peak power of a cycling stage test (Hawley and Noakes 1992). We read it in the original paper. It holds only for that test, with steps of 25 W every 150 seconds. Without a race or test, there will be no value.
We will update this note when a part goes live.
What Flow Momentum is not
Flow Momentum is a performance and wellness product. It does not diagnose illness or injury. It does not replace a doctor, physiotherapist or dietitian. See our Performance Health approach.
Sources
- Allen H, Coggan A (2019). Training and Racing with a Power Meter, 3rd edition. VeloPress. ISBN 978-1-948006-10-1
- Borresen J, Lambert MI (2009). The quantification of training load, the training response and the effect on performance. Sports Med 39:779–795. doi:10.2165/11317780-000000000-00000
- Buchheit M (2014). Monitoring training status with HR measures: do all roads lead to Rome? Front Physiol 5:73. doi:10.3389/fphys.2014.00073
- Busso T, Chalencon S (2023). Validity and accuracy of impulse-response models for modeling and predicting training effects on performance of swimmers. Med Sci Sports Exerc 55:1274–1285. doi:10.1249/mss.0000000000003139
- Calvert TW, Banister EW, Savage MV, Bach T (1976). A systems model of the effects of training on physical performance. IEEE Trans Syst Man Cybern SMC-6:94–102. doi:10.1109/TSMC.1976.5409179
- Cohen M, Tyagi A (2016). Yoga and heart rate variability: a comprehensive review of the literature. Int J Yoga 9:97. doi:10.4103/0973-6131.183712
- Daniels J, Gilbert J (1979). Oxygen Power: Performance Tables for Distance Runners. Book, no DOI.
- Foster C (1998). Monitoring training in athletes with reference to overtraining syndrome. Med Sci Sports Exerc 30:1164–1168. doi:10.1097/00005768-199807000-00023
- Foster C et al. (2001). A new approach to monitoring exercise training. J Strength Cond Res 15:109–115. doi:10.1519/00124278-200102000-00019
- Friel J. Quick guide to setting zones. TrainingPeaks.
- GoldenCheetah. Open-source performance software.
- Haddad M, Stylianides G, Djaoui L, Dellal A, Chamari K (2017). Session-RPE method for training load monitoring: validity, ecological usefulness, and influencing factors. Front Neurosci 11:612. doi:10.3389/fnins.2017.00612
- Hawley JA, Noakes TD (1992). Peak power output predicts maximal oxygen uptake and performance time in trained cyclists. Eur J Appl Physiol 65:79–83. doi:10.1007/BF01466278
- Hellard P, Avalos M, Lacoste L, Barale F, Chatard JC, Millet GP (2006). Assessing the limitations of the Banister model in monitoring training. J Sports Sci 24:509–520. doi:10.1080/02640410500244697
- Impellizzeri FM, Tenan MS, Kempton T, Novak A, Coutts AJ (2020). Acute:chronic workload ratio: conceptual issues and fundamental pitfalls. Int J Sports Physiol Perform 15:907–913. doi:10.1123/ijspp.2019-0864
- Jones AM, Vanhatalo A, Burnley M, Morton RH, Poole DC (2010). Critical power: implications for determination of VO2max and exercise tolerance. Med Sci Sports Exerc 42:1876–1890. doi:10.1249/MSS.0b013e3181d9cf7f
- Kontro H, Mastracci A, Cheung SS et al. (2026). The three-dimensional impulse-response model: modeling the training process in accordance with energy system-specific adaptation. PLoS One 21:e0341721. doi:10.1371/journal.pone.0341721
- Lucía A, Hoyos J, Santalla A, Earnest C, Chicharro JL (2003). Tour de France versus Vuelta a España: which is harder? Med Sci Sports Exerc 35:872–878. doi:10.1249/01.mss.0000064999.82036.b4
- Monod H, Scherrer J (1965). The work capacity of a synergic muscular group. Ergonomics 8:329–338. doi:10.1080/00140136508930810
- Morton RH, Fitz-Clarke JR, Banister EW (1990). Modeling human performance in running. J Appl Physiol 69:1171–1177. doi:10.1152/jappl.1990.69.3.1171
- National Sleep Foundation. What is sleep quality?
- Ohayon M et al. (2017). National Sleep Foundation's sleep quality recommendations: first report. Sleep Health 3:6–19. doi:10.1016/j.sleh.2016.11.006
- Phillips AJK et al. (2017). Irregular sleep/wake patterns are associated with poorer academic performance and delayed circadian and sleep/wake timing. Sci Rep 7:3216. doi:10.1038/s41598-017-03171-4
- Plews DJ, Laursen PB, Kilding AE, Buchheit M (2012). Heart rate variability in elite triathletes, is variation in variability the key to effective training? A case comparison. Eur J Appl Physiol 112:3729–3741. doi:10.1007/s00421-012-2354-4
- Plews DJ et al. (2013). Training adaptation and heart rate variability in elite endurance athletes. Sports Med 43:773–781. doi:10.1007/s40279-013-0071-8
- Rønnestad BR, Mujika I (2014). Optimizing strength training for running and cycling endurance performance: a review. Scand J Med Sci Sports 24:603–612. doi:10.1111/sms.12104
- Scudamore EM, Barry VW, Coons JM (2018). An evaluation of time-trial-based predictions of VO2max and recommended training paces for collegiate and recreational runners. J Strength Cond Res 32:1137–1143. doi:10.1519/jsc.0000000000001942
- Sletten TL et al. (2023). The importance of sleep regularity: a consensus statement of the National Sleep Foundation sleep timing and variability panel. Sleep Health 9:801–820. doi:10.1016/j.sleh.2023.07.016
- Tanaka H, Monahan KD, Seals DR (2001). Age-predicted maximal heart rate revisited. J Am Coll Cardiol 37:153–156. doi:10.1016/S0735-1097(00)01054-8
- TrainingPeaks. Normalized Power, Intensity Factor and Training Stress Score; Estimating TSS; The science of the Performance Manager.
- Wakayoshi K et al. (1992). Determination and validity of critical velocity as an index of swimming performance in the competitive swimmer. Eur J Appl Physiol 64:153–157. doi:10.1007/BF00717953
- Walsh NP et al. (2021). Sleep and the athlete: narrative review and 2021 expert consensus recommendations. Br J Sports Med 55:356–368. doi:10.1136/bjsports-2020-102025
- Watson NF et al. (2015). Recommended amount of sleep for a healthy adult: a joint consensus statement of the American Academy of Sleep Medicine and Sleep Research Society. Sleep 38:843–844. doi:10.5665/sleep.4716
- Wittmann M, Dinich J, Merrow M, Roenneberg T (2006). Social jetlag: misalignment of biological and social time. Chronobiol Int 23:497–509. doi:10.1080/07420520500545979
Frequently asked questions
Get the next Note
Practical ideas on performance, recovery, AI and better work — straight to your inbox.